
How to Read a Pump Curve Without Missing the Numbers That Matter
A pump curve can look reassuringly precise. Find the required flow on the horizontal axis, move up to the head curve and choose the model that crosses the duty point. That is the familiar method—and it is incomplete.
The same chart usually tells you whether the pump will run near its best efficiency point, how much shaft power it will absorb and how much net positive suction head it requires. Ignore those values and a selection that “meets the duty” may still overload its motor, cavitate or spend most of its operating life in an unfavourable region.
The Hydraulic Institute defines a pump performance curve as the relationship between flow and the head developed by a specific pump at a stated speed and impeller diameter. Efficiency, input power and NPSH3 are commonly plotted against the same flow axis.
Start with the conditions printed on the curve
Before reading any line, check the small print:
- Pump model and impeller diameter
- Rotational speed
- Test liquid and temperature
- Units for flow, head and power
- Whether power is pump shaft power or electrical input power
- Whether the curve is a general published curve or a certified curve for the supplied unit
Published centrifugal-pump curves are commonly based on water at about 20°C. A different liquid density changes power. Higher viscosity can change flow, head, efficiency and power, so a water curve should not be applied directly to oil or another viscous liquid.
Speed matters just as much. A curve at 2,900 rpm does not describe the same performance as a curve at 1,450 rpm, even when the casing and connection sizes are identical.
The five readings to take at the duty point
Consider an illustrative clean-water duty of 80 m³/h at 38 m total head. On the example chart, the pump curve and system curve meet close to that point.
1. Flow
Flow is read on the horizontal axis. It describes volume delivered per unit of time, not the pressure the pump creates.
Confirm the unit. Confusing m³/h with litres per second changes the quantity by a factor of 3.6. Also confirm whether 80 m³/h is the normal operating flow, a peak condition or one point in a wide demand range.
2. Total head
Head is read on the vertical axis. It is energy per unit weight of liquid, normally expressed in metres or feet of liquid.
Head is not simply the building height. The system requirement may include elevation, a pressure difference between source and destination, pipe friction and equipment losses. In a closed hydronic loop, static elevation is normally balanced by the return side; the pump mainly overcomes dynamic resistance.
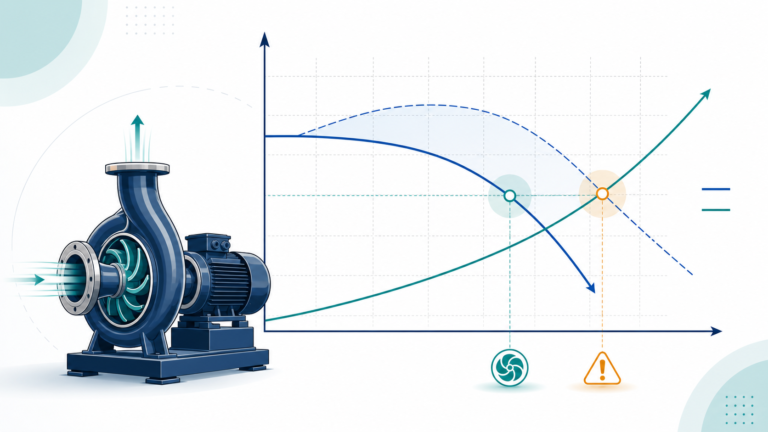
The actual operating point forms where the pump curve meets the system curve. A centrifugal pump does not independently “choose” 80 m³/h. If a valve closes or a filter becomes dirty, the system curve changes and the operating point moves.
3. Efficiency
Follow the duty point to the efficiency contour or efficiency curve. In this example, pump efficiency is 76%.
The best efficiency point, or BEP, is the flow and head at which hydraulic efficiency is highest for that speed and impeller diameter. It is also a useful reliability reference. The Hydraulic Institute notes that operation near BEP generally has lower noise, vibration and internal recirculation than operation far from it.
Do not invent a universal acceptable range around BEP. The preferred operating region and allowable operating region depend on pump type and manufacturer data. Check the stated limits on the supplied curve.
4. Shaft power
For water, the approximate pump shaft power is:
P = ρ × g × Q × H ÷ η
Using the example values:
- Density, ρ = 998 kg/m³
- Gravity, g = 9.81 m/s²
- Flow, Q = 80 m³/h = 0.0222 m³/s
- Head, H = 38 m
- Pump efficiency, η = 0.76
The result is approximately 10.9 kW of shaft power.
That is not automatically the electrical input. Motor and drive losses come afterward. With a 92% motor efficiency and no separate drive loss, input would be about 11.8 kW. The final motor size should be checked against the manufacturer’s absorbed-power curve across the full permitted operating range, not selected from this one calculation alone.
5. NPSH3
At the example duty, the curve shows NPSH3 = 3.2 m.
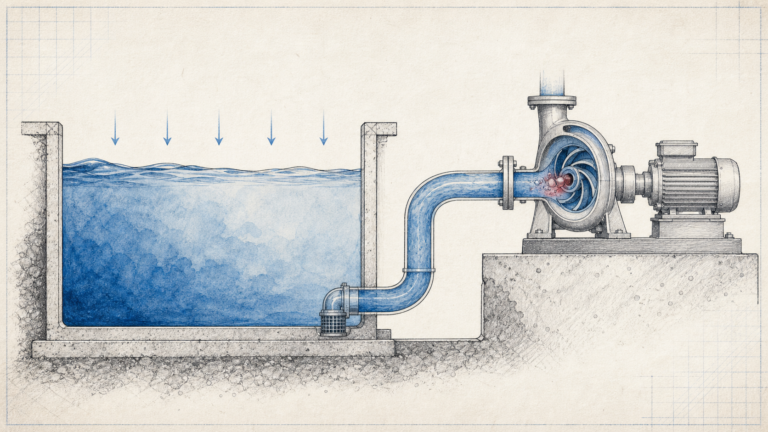
NPSH3 is a pump test value associated with a 3% head reduction, not a promise of cavitation-free service. The system designer must calculate NPSH available at the worst operating condition and provide an application-appropriate margin above the pump requirement.
The calculation should include the lowest liquid level, highest liquid temperature, suction-pipe loss, absolute pressure at the liquid surface and site elevation. A value measured at a remote tank does not reveal a blocked strainer or a high suction-line loss close to the pump.
A selection chart is not the final curve
Manufacturers often provide several levels of information.
A range chart helps identify a product family. It is useful for narrowing the search, but the envelopes are broad.
A published performance curve shows individual model or impeller curves with efficiency, power and NPSH information. This is the right level for preliminary selection.
A certified curve applies to the specific supplied pump, impeller and test condition. Projects with defined acceptance requirements may need factory performance testing and agreed tolerances.
Moving from a range chart to a detailed curve often reveals that two models can meet the same duty but do so at different efficiency, power or operating-region positions.
Read the whole operating range, not one dot
Most real systems do not remain at design flow. A booster system may vary with building demand. An HVAC loop may spend many hours at part load. A tank-transfer pump can see changing static head as levels move.
Mark the expected minimum, normal and maximum duties on the curve. Then check:
- Whether every point stays inside the manufacturer’s permitted region
- How efficiency changes across the load profile
- Whether absorbed power rises toward the end of the curve
- How NPSH3 changes as flow increases
- Whether a control valve, VFD or parallel-pump sequence changes the system curve
For variable-speed operation, do not assume all reduced-speed points sit at the same efficiency. Plot the reduced-speed pump curves against the actual system curve.
Three mistakes that survive a quick curve check
Reading pressure instead of head. A 38 m head is not always the same pressure increase for every liquid because pressure depends on density.
Using nominal pipe size as the duty. Connection size does not define flow. Two pumps with the same flange size can have very different curves.
Choosing the largest impeller “for margin.” A larger trim may move the duty away from BEP and create head that must be removed by throttling. State the design margin once and show it on the duty sheet.
What to send with a pump enquiry
A curve becomes useful only when the input duty is sound. For a preliminary selection, provide:
- Minimum, normal and maximum flow
- Total dynamic head at those flows
- Liquid, temperature, density and viscosity
- Suction arrangement and calculated NPSH available
- Operating hours and control method
- Power supply and motor requirements
- Materials, seals and applicable certification
- Installation and connection constraints
For clean-water building services, SHXINHUO’s ISG inline centrifugal pumps, TD multistage pipeline pumps and CDL vertical multistage pumps cover different flow-head regions and installation layouts. The model still has to be checked on its own detailed curve.
The useful question is not “Does the curve touch the duty?” It is “What happens to efficiency, power, NPSH and reliability at every duty the system will actually see?”
Technical references
- Hydraulic Institute Data Tool — Pump Curves
- Hydraulic Institute — Pump FAQs
- Hydraulic Institute Data Tool — Combined Pump and System Curves
Data note
The 80 m³/h example and plotted curves are created for explanation; they are not a SHXINHUO product curve. Final selection must use the current manufacturer curve for the exact model, speed and impeller.